SIQ Report
22. July 2024

 Back to all news
Simulations of explosions
When it comes to explosions, Slovenia is no exception. There have been significantly more explosions in Slovenia in recent years than in the past. Some of them, unfortunately, with fatalities. Explosion simulations are now an indispensable tool in explosion investigations, as they can help us to find out more precisely what went wrong.
After any explosion, scenes of material damage are to be expected, human injuries or fatalities aside. It is in this material damage, which at first sight makes one feel hopeless, that the investigations into the explosion are hiding some very welcome information. Broken glass on buildings is one of the key pieces of information in explosion investigations. The size of the shattered glass and the distance from the site of explosion provide the best estimate of the force of the explosion. Information on burns is also crucial, as this can be used to estimate the amount of explosive substance ignited in the explosion. All of this is valuable data for creating a simulation that gives us insight into what was really happening in those fateful moments.
Focusing on the not-so-rare example of an explosion that can occur as a result of a leaking gas cylinder in a domestic kitchen, we can quickly see how little gas from a cylinder is enough to cause a devastating explosion.
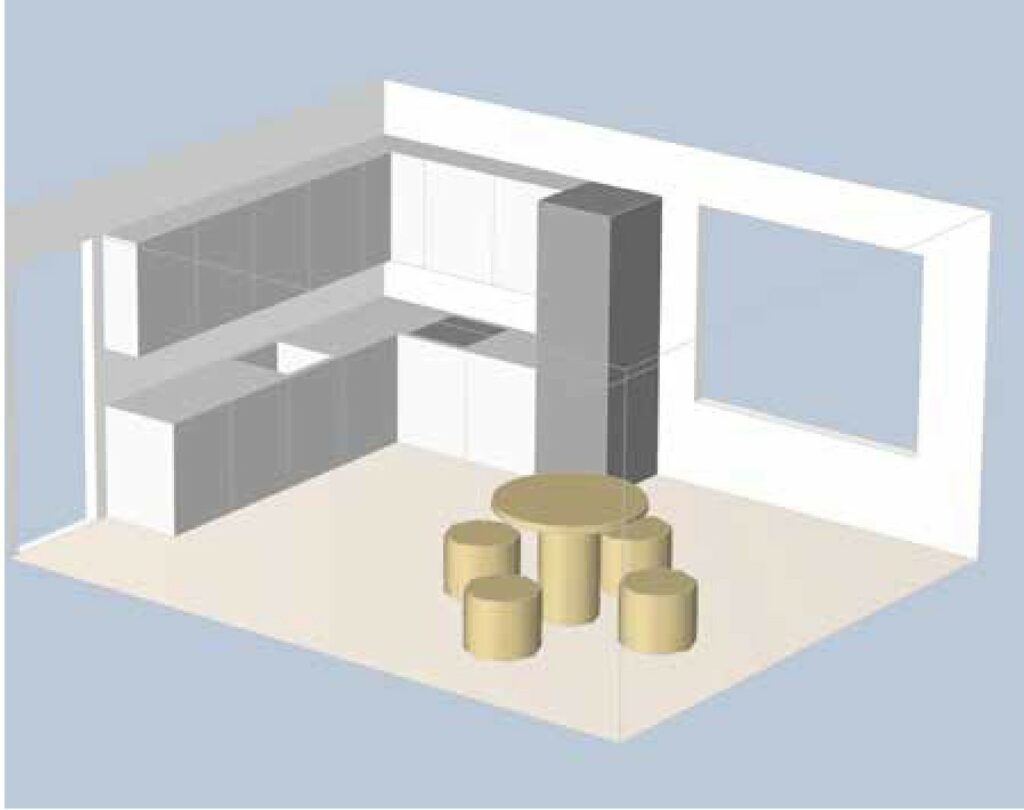
Figure 1: Kitchen model
Let’s look at this in a concrete kitchen model (Figure 1), where we have kitchen equipment with a stove to the left of the fridge. There is a gas cylinder installed in the cupboard under the stove. There is also a window to the right of the fridge and a dining table.
Gas leaks anywhere between the cylinder and the stove pose a risk of explosion in the kitchen. If we assume that the propane leak from the cylinder is a few g/s, we can work out how large an explosive atmosphere would be created. The greatest risk of explosion is in the vicinity of the cylinder, as shown in (Figure 2). The explosive atmosphere shown would result from a prolonged gas leak, assuming the kitchen door is open at all times and the gas is continuously diluted. The gas in the explosive atmosphere shown has a mass of 5g and, when mixed with air, occupies a volume of 40l.
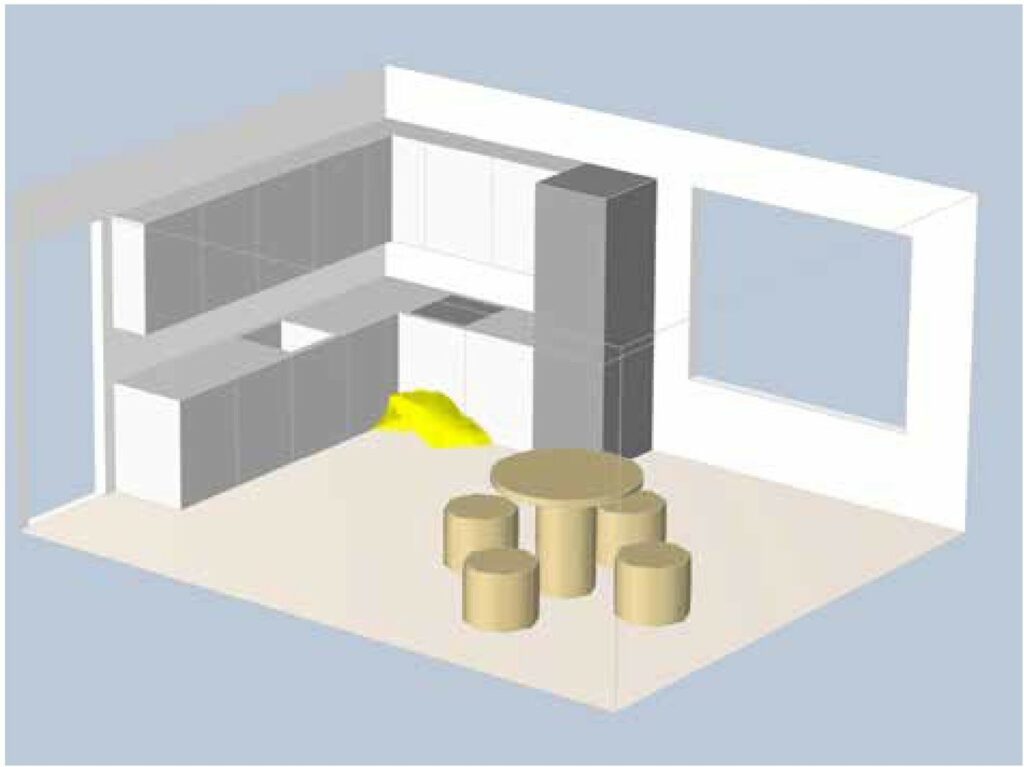
Figure 2: Explosive atmosphere due to gas leak
From this information on the size of the explosive atmosphere, we can further simulate the explosion or the pressure spread and heat propagation through the kitchen if it were to
an explosive atmosphere ignited by one of the ignition sources. In this particular case, it could be an electrical spark on the thermostat in the oven under the hob. The three figures above show the result of simulating the blast pressure at 20ms, 50ms, and 70ms after the explosion. The red colour shows the overpressure of the explosion and the blue colour shows the underpressure of the explosion, which always follows the overpressure.
The blast pressure on the window pane to the right of the refrigerator would exceed 10mbar, which would certainly cause the glass to shatter. The pressure would also exert such a force on the dining table that it would tip over. If all this really happened, we have confirmation that the explosion simulation is correct.
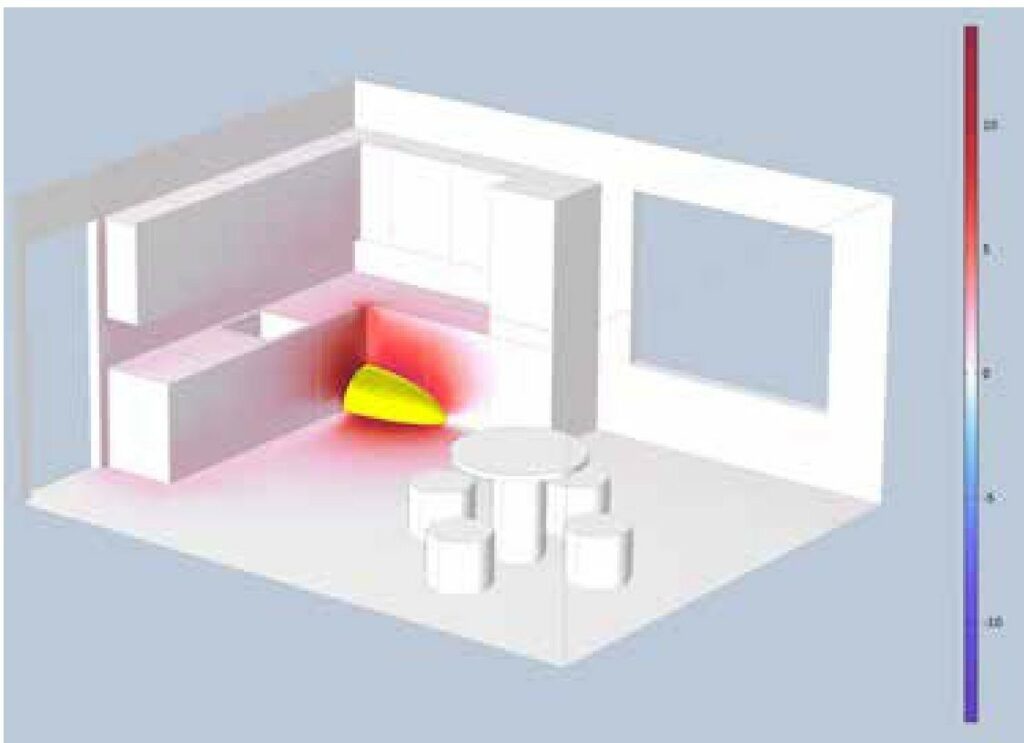
Figure 3: Explosion pressure after 20ms
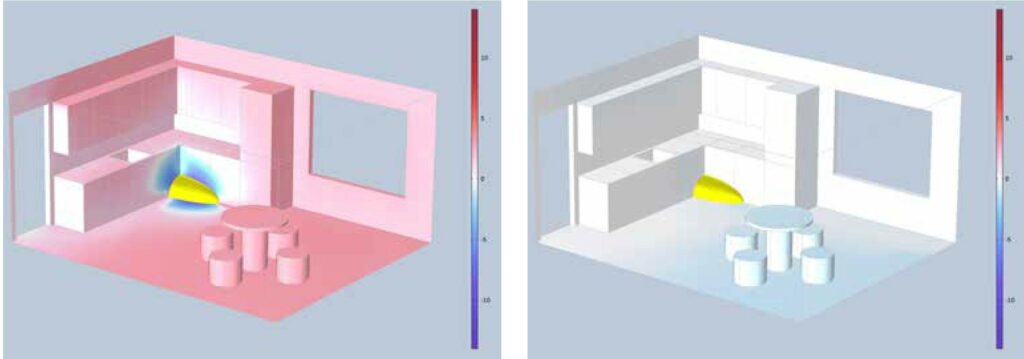
Figure 4: Explosion pressure after 50ms Figure 5: Explosion pressure after 70ms
Additionally, the thermal performance of the explosion can be assessed if the temperature at the centre of the explosion exceeds 2000°C. The results are shown in Figures 6, 7, and 8 at 0.5s, 1s, and 2s after the explosion.
This model shows the explosion that would occur if a gas cylinder leaked and ignited. A broken window, an overturned table and a scorched kitchen would be the most obvious signs of this explosion. But let’s not forget that only a few grams of gas are enough to cause such an explosion.
To prevent this particular explosion, the solution is cheap and easy – regular maintenance of gas installations.
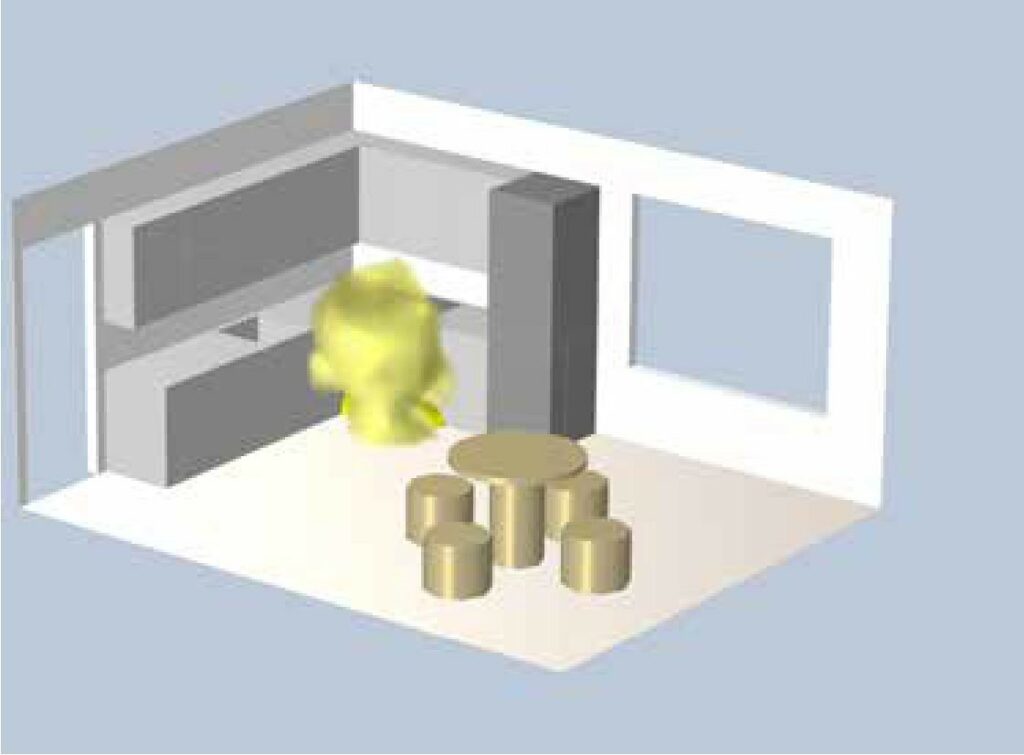
Figure 6: Heat spread after 0.5s
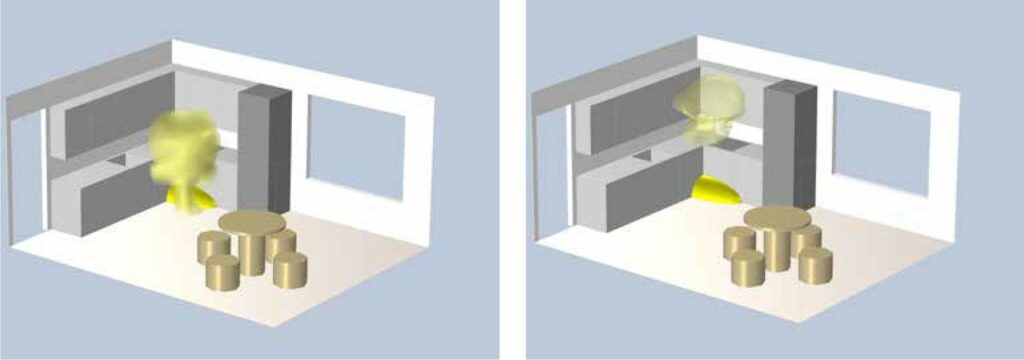
Figure 7: Heat spread after 1s Figure 8: Heat spread after 2s